
Block 1 – Introduction and Theoretical Foundations of PI Planning and Cross-Team Coordination
Introduction
In large-scale Agile environments, dozens of teams contribute simultaneously to shared strategic goals. Coordination across these teams becomes critical: not only what is delivered, but when and how dependencies are managed. The mechanism that synchronizes this complex network of work is Program Increment (PI) Planning.
According to the PI, Planning is the heartbeat of SAFe 6.0 — a recurring event that aligns business and technology teams toward common objectives for an 8- to 12-week period. During the two-day PI Planning session, teams define objectives, commit to deliverables, identify dependencies, and visualise them on a Program Board.
From a portfolio-management standpoint, PI Planning serves as the practical bridge between strategy and execution. As the PMI Standard for Portfolio Management states, a portfolio must “translate strategic objectives into coordinated investments and measurable results.” PI Planning performs exactly that translation by converting enterprise goals into executable features, stories, and iterations.
The PMI Agile Practice Guide emphasizes that in scaled Agile, coordination replaces control: value is created through alignment, transparency, and real-time feedback rather than hierarchical oversight. PI Planning embodies this principle — enabling autonomous teams to plan together, manage risk collectively, and share accountability for outcomes.
In practice, organizations run PI events every quarter. Each PI defines:
- Business Objectives — measurable results linked to strategy;
- Program Backlog — prioritized Features and Enablers;
- Dependencies and Risks — mapped across teams;
- Commitment and Confidence Vote — ensuring realistic plans.
Within Microsoft’s ecosystem, this entire process can be digitized using Azure DevOps, Planner Premium, Project for the web, LEO PPM, Power BI, and Power Automate, forming a unified environment for strategy-to-execution alignment.
Theoretical Foundations of PI Planning
1 Purpose and Logic of PI Planning
SAFe 6.0 defines PI Planning as a cadence-based synchronization mechanism that connects the business strategy, portfolio epics, and Agile Release Trains (ARTs).
The typical structure includes:
1. Defining PI Objectives — desired business outcomes;
2. Creating Program Board — dependencies, milestones, risks;
3. Balancing capacity vs load per team;
4. Conducting Confidence Vote and refinement.
The result is a single, transparent roadmap for the entire ART. In PMI terminology, this corresponds to the program level in the portfolio hierarchy, ensuring that resources and dependencies are coordinated across multiple projects.
2 The “Objectives → Features → Backlog” Model
Both PMI and SAFe frameworks advocate for cascading strategic intent into actionable work items.
This logic can be represented as:
| Level | Artifact | Example | Purpose |
| Strategic Objectives | Portfolio Epics / PI Objectives | “Improve Customer Onboarding Experience” | Defines why — the business value |
| Features / Capabilities | Program Backlog Items | “Automated Customer Profile Creation” | Describes what to build |
| Stories / Tasks | Team Backlog Items | “Develop API for registration data” | Defines how it will be implemented |
This cascade — Objectives → Features → Backlog — guarantees complete traceability from enterprise goals to team execution. It aligns with the value-delivery chain described in the PMI Agile Practice Guide and the Epic–Feature–Story hierarchy in SAFe.
3 Microsoft Ecosystem for PI Planning
Modern Microsoft 365 and Power Platform tools can fully support this model:
| Function | Recommended Tool | Key Capability |
| Strategic Objectives / Portfolio | LEO PPM (Power Platform custom app) | Portfolio structure, roadmaps, custom Gantt Chart |
| Program Features / Epics | Azure DevOps Boards | Feature backlog, dependencies, iteration planning |
| Team Backlog / Kanban | Planner Premium (in Teams) | Quick visual boards, checklists, lightweight task tracking |
| Roadmaps / Timeline | LEO PPM (Power Platform custom app) | Visual roadmaps, cross-project timelines |
| Analytics & Flow Metrics | Power BI | Dashboards for throughput, predictability, flow efficiency |
| Automation / Sync | Power Automate | Integration between Planner, DevOps, Dataverse |
| Data Repository | Dataverse | Unified data model for Objectives–Features–Stories |
Through this combination, organizations can conduct PI Planning digitally, synchronizing data across systems without leaving the Microsoft ecosystem.
4 PI as the Bridge Between Strategy and Execution
The PMI Portfolio Management Standard underlines that portfolios deliver strategic alignment through continuous review and re-prioritization.
SAFe complements this by introducing a regular PI cadence — a quarterly rhythm for learning and adaptation.
Together they form a closed feedback loop:
Strategy → Portfolio → Program → Teams → Outcomes → Benefits → Feedback → Strategy
This structure ensures that every execution iteration contributes measurable business value, not just completed output.
Planner Premium vs LEO PPM – Flexibility and Scalability
1 Planner Premium – Convenience with Limitations
Planner Premium (formerly Project for the Web) is ideal for small or mid-sized groups needing quick visual coordination.
It offers integrated Kanban boards, task assignments, checklists, and due dates within the Microsoft ecosystem.
However, its simplicity brings limitations:
- No support for hierarchical data (Epic–Feature–Story);
- Limited customization — no additional fields or automations;
- Restricted API access for advanced integrations.
- No portfolio-level dependency view or cross-team Gantt chart.
In PI Planning contexts, Planner Premium is best suited for team-level execution, not enterprise-level coordination.
2 LEO PPM – Flexibility and Enterprise Scale
LEO PPM, built entirely on the Microsoft Power Platform, enables a fully configurable PI-planning architecture.
It combines the governance of PMI standards with the agility of SAFe planning cycles.
Key advantages:
- Configurable Dataverse model for Objectives–Features–Stories relationships;
- Built-in Gantt Chart and Program Board visualisations;
- API-level integration with Azure DevOps (Epics, Features, Stories);
- Custom extensions through low-code development;
- Deep analytics via Power BI and automation through Power Automate.
LEO PPM therefore suits organizations seeking an adaptable system that scales from portfolio governance down to team delivery while maintaining transparency and control.
3 PI Planning as a Strategic Cycle
In practice, a mature PI process unites three management layers:
| Layer | Scope | Key Output |
| Strategic Portfolio | Vision → Investment Themes | Funded Epics & Objectives |
| Program / ART | PI Objectives → Features | Program Board, Capacity Plan |
| Team Execution | Features → Stories → Tasks | Iteration Goals, Velocity Reports |
When synchronized through Microsoft tools — LEO PPM, Azure DevOps, Planner Premium, and Power BI — this creates a seamless digital thread from vision to value.
Summary of Block 1
1. PI Planning is not an event but a systemic rhythm that synchronizes teams and drives predictability.
2. SAFe 6.0 provides the process foundation, while PMI standards define the governance and benefits framework.
3. The Microsoft ecosystem offers a complete technological stack — Planner Premium, Azure DevOps, LEO PPM, Power BI, and Power Automate — that digitizes the entire PI process.
4. Planner Premium delivers quick, lightweight coordination but lacks extensibility.
5. LEO PPM enables enterprise-grade customization, integrations, and portfolio analytics.
- PI Planning is not a one-off event but an ongoing, systemic cadence that aligns teams and enhances predictability across the organization.
- SAFe 6.0 establishes the foundational processes for PI Planning, while PMI standards provide the overarching governance and framework for realizing business benefits.
- The Microsoft ecosystem—including Planner Premium, Azure DevOps, LEO PPM, Power BI, and Power Automate—enables end-to-end digitization of the PI Planning process.
- Planner Premium offers fast, intuitive coordination for teams, though it has limited extensibility for more complex needs.
- LEO PPM supports robust enterprise-level customization, deep integrations, and advanced portfolio analytics to drive strategic outcomes.
Block 2 – Tools and Templates for PI Planning in the Microsoft Ecosystem
Architecture of PI Planning in SAFe
In SAFe 6.0 – PI Planning, a Program Increment (PI) represents a fixed planning and execution window (typically 8–12 weeks) during which multiple Agile Teams align to common business objectives.
PI Planning synchronizes all workstreams inside an Agile Release Train (ART) through a structured cadence.
Each PI cycle includes:
1. Team Breakouts – Teams define Features and Stories, estimate capacity, and surface risks.
2. Program Board & Confidence Vote – Dependencies are mapped, risks mitigated, and a unified plan confirmed.
In PMI terms (PMI Portfolio Management Standard), this corresponds to the program level — the tactical bridge linking portfolio strategy with team execution.

Figure 1. Program Board showing cross-team dependencies within a PI cycle.
The Objectives → Features → Backlog Model in Azure DevOps
The PMI Agile Practice Guide describes a value cascade from strategy to execution.
In Azure DevOps Boards, this is implemented as:
| Level | Artifact | Example | Purpose |
| Strategic Objective | Epic / Objective | “Enhance customer onboarding experience” | Defines why — business value |
| Feature / Capability | Program Backlog Item | “Automate profile creation” | Describes what to build |
| Story / Task | Team Backlog Item | “Create API for registration data” | Describes how to implement |
DevOps captures traceability, effort, and status; Power BI visualizes velocity, throughput, and predictability across iterations.
Planner Premium vs LEO PPM in PI Execution
Planner Premium – Convenience with Constraints
Planner Premium offers fast, lightweight Kanban coordination directly in Teams.
Ideal for day-to-day team tracking, it supports buckets, priorities, and checklists but lacks enterprise-scale depth:
- No hierarchical Epic→Feature→Story links.
- Limited field customization and automation.
- Minimal API for integration.
- No portfolio-level dependency or Gantt view of Portfolio.
Hence, Planner Premium fits team-level execution, not program-level orchestration.
LEO PPM – Enterprise Flexibility and Scalability
Built on Microsoft Power Platform, LEO PPM provides a fully configurable PI-planning framework.
Its Dataverse model aligns Objectives → Features → Stories across portfolios and programs.
Key capabilities
- Configurable entities and relationships for Objectives, Features, and Stories.
- Integrated Gantt Chart and Program Board visuals.
- Two-way sync with Azure DevOps via API.
- Custom logic and extensions through low-code development.
- Analytics and dashboards via Power BI; automation via Power Automate.
LEO PPM enables enterprises to tailor PI processes, embed portfolio governance, and continuously expand functionality.
PI Planning Template inside Microsoft Ecosystem
| Phase | Description | Microsoft Tool |
| 1 Preparation | Define PI Objectives, draft Features | LEO PPM / Project for the web |
| 2 Planning Session | Team breakouts, Program Board, risk review | Azure DevOps / Planner Premium |
| 3 Tracking & Inspect | Burn-up charts, flow metrics, predictability dashboards | Power BI / Power Automate |
All artifacts are stored in Dataverse, ensuring a single source of truth and traceability from strategy to delivery.
Dependency Matrix and Cross-Team Visualization
Dependencies pose the most significant delivery risk in PI. Mapping them in Power BI reveals bottlenecks early.
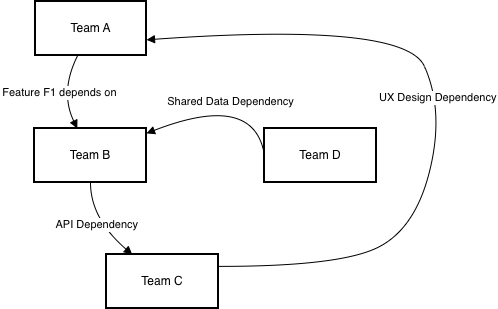
Figure 2. Dependency Matrix showing inter-team relationships.
PI Metrics and Power BI Analytics
Essential quantitative views include:
| Metric | Definition | Tool |
| Throughput | Completed story points per iteration | Azure DevOps/Jira |
| Predictability Index | Actual / Planned value | LEO PPM Roadmap |
| Flow Efficiency | Active Time / Lead Time | Dataverse + Power BI |
| Dependency Lead Time | Time from identification to resolution | Dataverse + Power BI |
Power BI consolidates this data into dashboards such as Velocity vs Plan, Predictability Gauge, and Dependency Heatmap, which are automatically updated via the Power BI service, which connects to the different data sources.
Automation Flows in Power Automate
Automation connects every layer of the ecosystem:
- Jira/AzDevOps → Dataverse – mirror tasks into LEO PPM backlog.
- Dataverse → Jira/AzDevOps – sync status, efforts, custom fields.
- Dataverse → Power BI – feed real-time reporting.
This removes manual data handling and creates a closed digital loop of “Plan → Execute → Measure.”
Key Takeaways from Block 2
1. SAFe PI Planning establishes a rhythm of synchronized delivery and predictability.
2. PMI and Agile Practice Guide provide methodological structure for Objectives → Features → Backlog.
3. Microsoft ecosystem enables end-to-end PI digitization through DevOps, Planner Premium, LEO PPM, Power BI, and Power Automate.
4. Planner Premium is ideal for quick team-level coordination but is limited in customization.
5. LEO PPM delivers enterprise flexibility and custom extensions.
6. Power BI and Power Automate provide analytics and integration that convert PI Planning into a continuous value-management cycle.
Block 3 – Metrics and Value Management in the PI Cycle
Introduction — Why Value Measurement Matters
Modern Agile enterprises are increasingly judged not by delivery speed but by value realized.
SAFe 6.0 – Measuring Business Agility defines value flow as the primary indicator of enterprise health: strategy, portfolios, programs, and teams must align on a single question — “Are we delivering measurable benefit?”
The PMI Benefits Realization Management Standard similarly frames value as a life-cycle that begins with benefit identification, continues through tracking during execution, and ends with validation and sustainment.
PI (Program Increment) Planning provides the operational rhythm for that value cycle. Each PI produces measurable outcomes that are reviewed during the Inspect & Adapt workshop, closing the feedback loop between strategic intent and actual benefits.
Approaches to Benefits Realization: PMI and SAFe
| Dimension | PMI Benefits Realization | SAFe Lean Portfolio Management |
| Purpose | Ensure promised benefits are achieved and sustained | Continuously evaluate delivered value and adjust portfolio |
| Pre-Execution Phase | Benefit Identification and Mapping | Strategic Themes and Epic Hypotheses |
| Execution Phase | Benefit Tracking and Measurement | PI Objectives and PI Metrics |
| Post-Execution Phase | Benefit Sustainment Review | Inspect & Adapt Workshop |
| Responsible Roles | Portfolio Manager / Business Owner | LPM Team / RTE / Product Managers |
Both perspectives stress that benefits, not output, define success.
Key Metrics for the PI Cycle
1 Throughput
Number of completed story points or features per increment.
Formula: Throughput = Σ (Completed Items / PI Duration)
Source: Azure DevOps / LEO PPM Backlog/Jira Backlog
2 Predictability Index
Ratio of delivered to committed work.
Formula: Predictability = Actual / Planned × 100 %
Target: 80–100 % is considered healthy.
3 Flow Efficiency
Portion of total cycle time during which work is actually active.
Formula: Flow Efficiency = Active Time / Lead Time × 100 %
Insight: Low efficiency (< 40 %) indicates waiting or bottlenecks.
4 Dependency Lead Time
Elapsed time from identifying a dependency to resolving it.
Measured in Power BI using LEO PPM/DevOps/Jira event timestamps.
5 Return on Investment (ROI)
Compares cost to realized benefit.
Formula: ROI = (Benefits – Costs) / Costs × 100 %
Source: LEO PPM Benefits Module / Finance System.
Power BI Analytics and Automation
Power BI Service connects directly to Azure DevOps/Jira and Dataverse to visualise PI metrics.
Typical dashboards:
- Velocity & Throughput: trend of story points completed.
- Predictability Gauge: plan vs actual per team.
- Dependency Heatmap: frequency and age of open dependencies.
- Flow Timeline: cycle time distribution per feature.
- ROI Tracker: aggregated benefit versus cost.
Power Automate keeps these dashboards live through scheduled flows:
DevOps/Jira → Dataverse → Power BI and Planner → LEO PPM updates run nightly or on demand.
LEO PPM as the Value Realization Center
LEO PPM, built on Microsoft Power Platform, centralizes benefit tracking.
It aggregates data from Azure DevOps, Planner Premium, and Dataverse into a single Value Dashboard.
| Data Type | Source | Metric |
| Story Points / Features | Azure DevOps/Jira | Throughput |
| Planned vs Actual Work | LEO PPM Roadmap | Predictability Index |
| Cycle Time / Wait Time | DevOps + Power BI | Flow Efficiency |
| Dependency Events | Dataverse | Dependency Lead Time |
| Benefit Values | LEO PPM Benefits Module | ROI |
This integration creates a closed feedback loop linking strategy → execution → value → learning.

Figure 3. The Value Flow Loop – a continuous cycle of Strategy → Execution → Value → Feedback
Executive Insights
1 KPI vs Source of Data
| KPI | Formula | Primary Source | Review Cadence |
| Throughput | Σ Completed Items / PI | Jira/Azure DevOps | Weekly |
| Predictability | Actual / Planned × 100 % | LEO PPM Roadmap | Bi-weekly |
| Flow Efficiency | Active Time / Lead Time | Power BI | Weekly |
| Dependency Lead Time | Resolved – Identified | Dataverse / BI | Real time |
| ROI | (Benefits – Costs)/Costs × 100 % | LEO PPM Benefits | Quarterly |
Recommendations for Leadership and PMO
1. Establish a single portfolio of metrics.
Combine PI data from Jira/Azure DevOps and LEO PPM into Power BI Scorecards.
2. Focus on benefits, not output.
Every PI should include a business hypothesis and expected value KPIs.
3. Measure predictability over time.
Stable plan-vs-actual performance indicates organizational maturity.
4. Automate data flows.
Use Power Automate to keep systems synchronized and reduce manual effort.
5. Evolve LEO PPM into a value hub.
Extend its Benefits module with forecasting models and AI-driven insights.
Conclusions
- Value management is the core of the PI cycle. It ensures that initiatives are aligned with strategic objectives and deliver measurable business outcomes.
- Metrics such as Throughput, Predictability, Flow Efficiency, and ROI define real agility. Monitoring these metrics helps organizations identify bottlenecks, drive continuous improvement, and enhance responsiveness to change.
- Power BI and Power Automate enable a digital feedback system for evidence-based governance. Real-time dashboards and automated workflows support data-driven decision-making and transparency across teams.
- LEO PPM unites planning, execution, and benefit tracking into a single ecosystem built on Microsoft Power Platform. This integration fosters collaboration, streamlines processes, and provides a holistic view of portfolio performance.
- To further strengthen these conclusions, organizations should:
- Adopt predictive analytics and AI capabilities to anticipate risks and forecast outcomes more accurately.
- Integrate external benchmarking data to compare performance against industry standards and best practices.
- Promote a culture of continuous learning by regularly reviewing lessons learned and integrating feedback into future cycles.
- Enhance stakeholder engagement with interactive reports and self-service analytics, empowering decision-makers at all levels.
- Leverage automation to reduce manual effort and ensure data consistency across platforms.
By embracing these strategies, organizations can maximize the value delivered through their portfolio investments, improve agility, and achieve sustainable business growth.
Block 4 – References and Links
1 Methodological Standards and Frameworks
- Project Management Institute (PMI).
The Standard for Portfolio Management, 4th Edition, 2021.
https://www.pmi.org/standards/for-portfolio-management - PMI.
Benefits Realization Management: A Practice Guide.
https://www.pmi.org/standards/benefits-realization - PMI.
Agile Practice Guide, 2017.
https://www.pmi.org/standards/agile - Scaled Agile Framework (SAFe).
PI Planning (Version 6.0).
https://scaledagileframework.com/pi-planning - Scaled Agile Framework (SAFe).
Business Agility.
https://framework.scaledagile.com/business-agility - Scaled Agile Framework (SAFe).
Lean Portfolio Management.
https://scaledagileframework.com/lean-portfolio-management
2 Microsoft Power Platform and DevOps Resources
- Microsoft Learn.
Azure DevOps Boards Documentation.
https://learn.microsoft.com/en-us/azure/devops/boards/ - Microsoft Learn.
Power Automate Documentation.
https://learn.microsoft.com/en-us/power-automate/ - Microsoft Learn.
Power BI Documentation..
https://learn.microsoft.com/en-us/power-bi/ - Microsoft Learn.
Planner Documentation.
https://learn.microsoft.com/en-us/planner/
